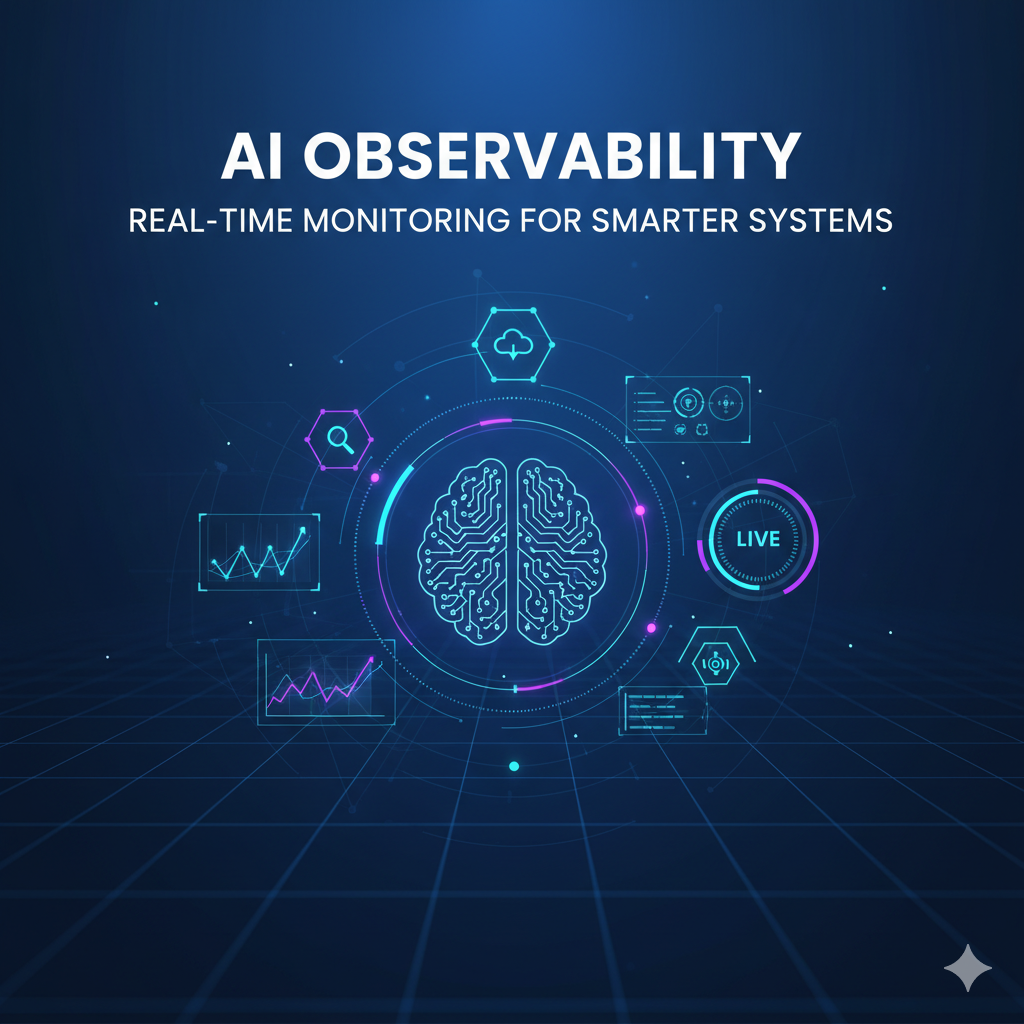
AI Observability: Real-Time Monitoring for Smarter Systems
Modern enterprises are rapidly embedding AI and machine learning into production systems. According to a recent DevOps report, 81% of companies are prioritizing AI in their workflows. As ML models power critical functions—from fraud detection to customer support—they add new layers of complexity. Unlike traditional applications, AI systems behave like dynamic black boxes: they continuously learn and evolve, making their outputs hard to predict. AI observability bridges this gap by giving teams continuous, real-time visibility into how models and data behave in production. In practice, AI observability means collecting logs, metrics, traces, and model-specific data (inputs, outputs, predictions) so engineers can diagnose issues as they happen. It turns an opaque AI “black box” into a glass box, helping organizations detect drift, bias or failures before they impact users.
Observability vs. Traditional Monitoring
AI observability is more than just standard monitoring. Traditional monitoring tools focus on known infrastructure metrics (CPU, memory, uptime) and alert on fixed thresholds. By contrast, AI observability correlates those infrastructure signals with model behavior. It tracks not just system health, but why a model made certain decisions. For example, while a conventional monitor might alert on high response latency, an AI observability system also logs the model inputs and predictions that caused the slowdown. As one expert explains, observability provides “the context [engineers] need to understand, troubleshoot, and optimize their AI systems”.
This deeper visibility is crucial for addressing hidden issues. Without observability, subtle problems like data drift or emerging biases can go unnoticed. A model’s accuracy might slowly degrade even as performance dashboards look normal. In fields like healthcare or finance, this silent decay can be disastrous: undetected model errors could lead to wrong diagnoses or major financial losses. In contrast, an observable AI platform lets teams correlate input data changes with output shifts, so they spot and fix such issues early. In short, observability transforms a black box into a glass box, making it possible to understand and trust AI outputs.
Core Observability Components
Effective AI observability relies on several linked components that together provide a full picture of system behavior:
- Metrics & Monitoring: Continuously track key metrics. This includes infrastructure metrics like throughput and latency, and model-specific metrics like prediction accuracy or token counts. For example, teams monitor LLMs by tracking response times, API usage, error rates, and cost per request. These live metrics establish a baseline and flag deviations (e.g. a sudden drop in accuracy or spike in error rates).
- Logging: Emit structured logs for every inference. Logs should record inputs, outputs, model versions, and any exceptions. Structured logs make ML decisions traceable: one can replay a request and see exactly how a model responded. These logs support audits and compliance. For instance, capturing the full prompt and response history is essential in generative AI applications to diagnose hallucinations or rule out data leaks.
- Tracing: Trace the end-to-end flow of data through the AI pipeline. Using distributed tracing or request IDs, teams link every step from data ingestion, through preprocessing, to inference and postprocessing. Tracing uncovers where delays or failures occur – for example, whether a slow inference is due to the model, a GPU bottleneck, or a network glitch. A unified trace enables engineers to pinpoint root causes across microservices or servers.
- Data Observability: Monitor data quality and drift at the inputs. This means validating schemas, checking for missing or anomalous values, and tracking statistical distributions of incoming data. If the input data gradually shifts from the training distribution (data drift), observability tools raise alerts. Data observability ensures the model is not fed garbage; it acts as an early warning system for potential model degradation.
- Model Performance Tracking: Measure prediction quality over time. Key performance indicators (accuracy, precision, recall, F1, etc.) are tracked continuously. For unsupervised or generative models, metrics like perplexity, statistical divergence, or custom quality scores are used. Observability platforms often include tools to compute drift statistics on output distributions or latent embeddings. This lets teams detect when a model’s effectiveness is changing and triggers retraining or analysis.
- Alerts & Dashboards: Present observability data in real time. Dashboards visualize trends (accuracy over time, latency histograms, resource usage, etc.) for developers and stakeholders. For example, one platform shows prediction confidence and model health at a glance. Alerts notify teams when anomalies occur: e.g. a sudden spike in bad outputs, an unusual drop in throughput, or a new bias emerging. Smart alerting (using statistical or AI-based anomaly detection) helps avoid noise – it surfaces only high-impact incidents. Together, dashboards and alerts enable real-time awareness and immediate response to AI system issues.
Why Real-Time Monitoring Matters
AI-powered systems often operate in fast-moving environments where delays in detecting problems can be costly. Real-time monitoring brings several advantages:
- Early Drift and Anomaly Detection: By watching metrics continuously, teams catch drift or anomalies as soon as they appear. For example, real-time dashboards provide a live view of model pipelines, “reducing guesswork” and alerting engineers to issues before users notice. This is critical for applications like fraud detection, where latent model degradation can allow fraud to slip through.
- Proactive Incident Response: Immediate alerts enable faster troubleshooting. Instead of learning about model failures from end-user complaints, engineers get notified of anomalies (e.g. an unusual error rate or a sudden change in output distribution) as they happen. AI observability turns monitoring into a continuous feedback loop: every incident feeds insights back into model improvement and infrastructure tuning.
- Cost and Resource Optimization: Real-time insights help control costs. For example, monitoring token usage and latency across LLM calls lets teams identify inefficient queries or idle infrastructure. Platforms can even forecast future usage: New Relic notes that AI analytics can predict when a model will need retraining or when resource capacity will be exceeded. Armed with live cost dashboards, organizations can set budget alerts (e.g. on token spend per team or model) and avoid surprise bills.
- Enhanced Trust and Compliance: In regulated industries, observability supports auditability. Real-time logging of model inputs/outputs and decision traces creates a verifiable record for compliance. For instance, Honeycomb points out that observability provides traceable decision-making needed for regulations like GDPR or HIPAA. Teams can immediately inspect any output (and its antecedent data) in case of a complaint or audit.
Importantly, observability pays off: a Forrester study found a 357% ROI on AI observability investments over three years, with payback in under six months. One airline, JetBlue, improved its Net Promoter Score by 16 points within a year by applying observability practices to its data pipelines and AI features. These results underscore that real-time monitoring leads to smarter, more reliable AI systems and better business outcomes.
Key Tools for AI Observability
A variety of tools and platforms now specialize in ML/AI observability. These range from ML-focused monitoring services to general-purpose observability stacks. Some notable examples include:
- Arize AI: A model observability platform offering real-time performance monitoring and automated drift detection for production models. Arize supports both traditional models and LLMs, with dashboards that have surface failure modes and bias. Its users report that Arize helps “catch potential issues early,” preventing silent failures.
- Fiddler AI: An explainability and observability platform focused on trust. Fiddler continuously monitors for drift, bias, and data quality issues, and also provides local and global explanations (feature importances, counterfactuals) for model predictions. It can trace entire LLM workflows (prompts through chains of tools) and enforce safety guardrails in real time.
- Evidently AI: A monitoring tool that emphasizes automated data and model quality checks. Evidently includes pre-deployment tests (to catch bad inputs) and live dashboards for dozens of ML metrics (accuracy, drift, distribution stats, etc.). It alerts teams to anomalies in inputs or predictions and simplifies root-cause analysis with visual reports.
- WhyLabs: An open-source AI observability toolkit with a privacy focus. WhyLabs collects all model inferences (no sampling) and tracks data quality, drift, fairness, and even adversarial issues (like prompt injections or hallucinations) in real time. Its architecture is designed for regulated environments: only metadata is shipped, meeting strict compliance requirements.
- Monte Carlo: Originally a data observability platform, Monte Carlo now extends into AI. It provides end-to-end lineage (so you can trace data from ingestion through model output) and uses AI-powered sensors to detect anomalies in data pipelines and models. It also offers Agent Observability to monitor LLM agent outputs and data feeding large language models.
- Grafana + Prometheus: An open-source stack for metrics. Teams often instrument models and inference services to expose Prometheus metrics (latency, request counts, errors) and visualize them in Grafana. Grafana’s alerting and dashboard capabilities (including ML-focused plugins) can serve as a lightweight observability solution.
- Enterprise Monitoring Suites: Platforms like Datadog, Dynatrace, New Relic, and LogicMonitor have added AI observability features. For example, LogicMonitor’s “Envision” product can ingest GPU metrics, LLM API usage (tokens, latency, errors), and vector database stats into a single dashboard. New Relic’s AI Monitoring tracks LLM response times, token usage, and error rates in real time. These tools leverage AI/ML internally to auto-detect anomalies and correlate alerts across the full stack.
- Cloud ML Services: Major cloud providers offer built-in model monitors. AWS SageMaker Model Monitor can detect data and concept drift on streaming inference data, Azure Machine Learning has drift detectors and data monitors, and Google Vertex AI provides pipeline monitoring for deployed models. These services integrate tightly with their cloud ecosystems for easy setup.
In practice, many organizations use a hybrid approach: they feed ML metrics into their general observability stack (using OpenTelemetry or custom metrics) while also employing specialized ML monitoring tools. The goal is a single pane of glass where data engineers and SREs can see AI metrics alongside app and infra metrics.