DevOps Metrics That Matter: How to Measure the Success of Your DevOps Initiatives

Introduction
Measuring the success of DevOps initiatives is critical for organizations striving to improve software delivery, operational efficiency, and overall business outcomes. Many organizations, however, struggle to adopt the right metrics, often relying on outdated or misleading indicators. In this comprehensive guide, we explore the most effective DevOps metrics and key performance indicators (KPIs) for 2025, while debunking common misconceptions that hinder progress.
Key DevOps Metrics
1. DORA Metrics
The DevOps Research and Assessment (DORA) team identified four key performance indicators, known as The Four Keys, to measure DevOps success:
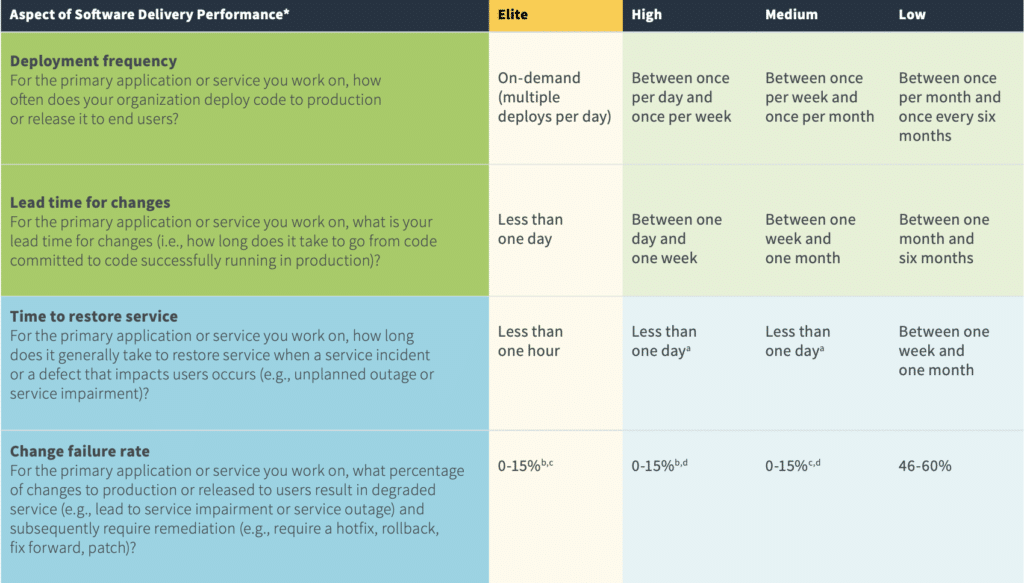
Deployment Frequency
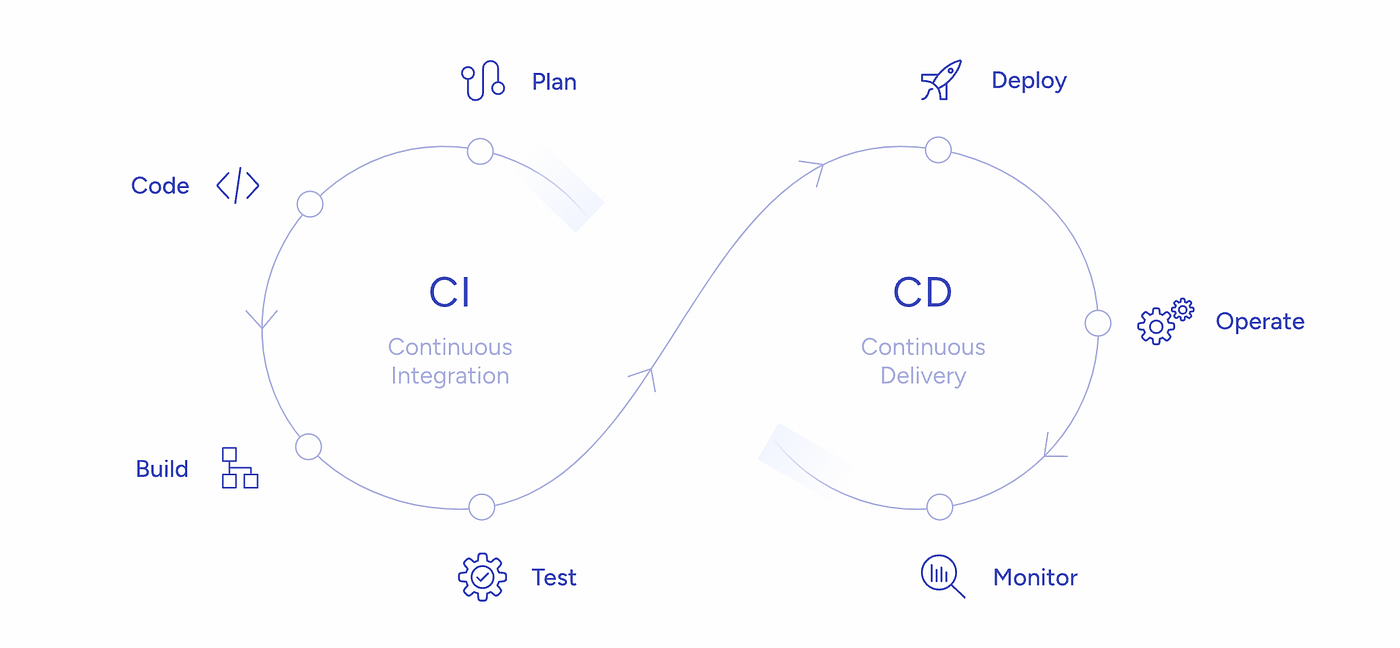
This metric tracks how often an organization successfully deploys software to production. The rise of CI/CD has led to multiple deployments per day in elite teams, significantly enhancing efficiency and customer feedback loops. Organizations should strive for frequent, small releases rather than large, infrequent deployments to reduce risks and improve adaptability. Key actions include:
- Implementing continuous integration and delivery (CI/CD) pipelines.
- Encouraging trunk-based development and feature flags.
- Automating testing and deployment validation.
Lead Time for Changes
The time taken for a committed code change to reach production is a crucial metric for evaluating a team's efficiency. Shorter lead times generally indicate a well-optimized CI/CD pipeline. Organizations should assess bottlenecks in their pipelines, automate repetitive tasks, and ensure smooth handoffs between teams to improve lead times. Best practices include:
- Streamlining development workflows and approval processes.
- Using automated testing suites to catch issues early.
- Enhancing developer feedback loops with immediate validation.
Change Failure Rate
This metric measures the percentage of failed deployments in production. A lower failure rate indicates a more reliable DevOps process. Elite teams aim for a failure rate between 0-15%, while low-performing teams often exceed 40%. To reduce failure rates, organizations should:
- Implement automated regression and integration testing.
- Use canary deployments and blue-green deployment strategies.
- Foster a culture of collaboration between development and operations teams.
Mean Time to Restore (MTTR)
MTTR measures how quickly a team recovers from failures. Elite teams typically restore services within an hour, whereas less efficient teams may take weeks. Organizations should focus on monitoring, alerting, and disaster recovery strategies to enhance their MTTR and minimize downtime. Key strategies include:
- Implementing robust incident response and on-call rotations.
- Utilizing real-time monitoring and AI-driven anomaly detection.
- Conducting post-mortems to learn from past incidents.
2. Test Case Coverage
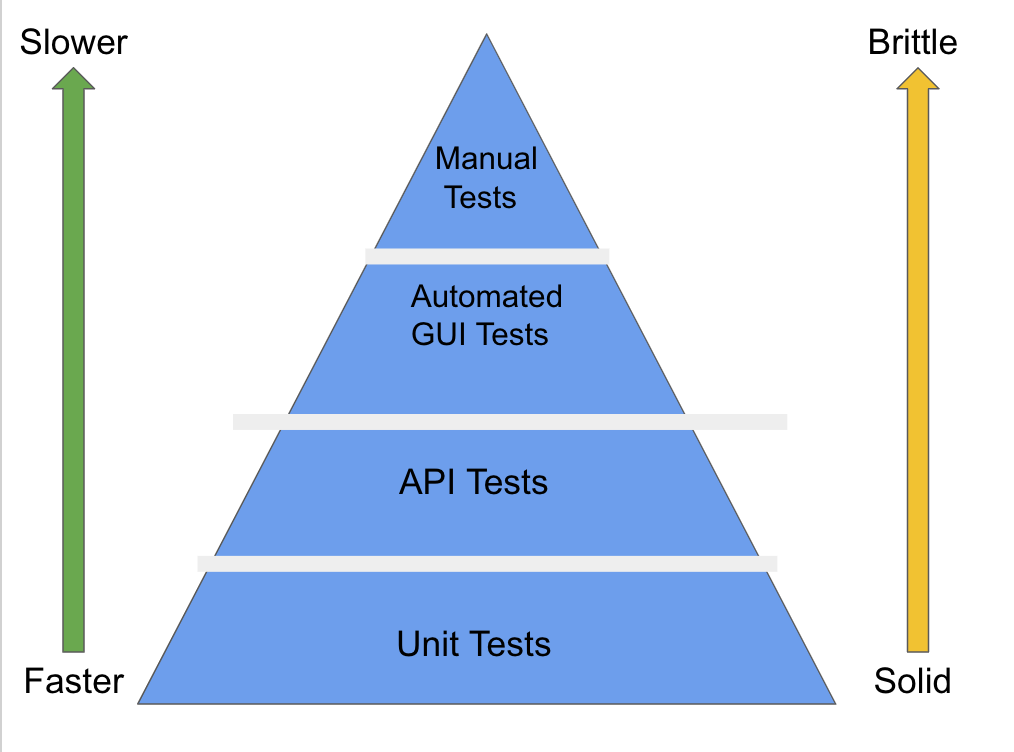
Test case coverage ensures that software undergoes rigorous testing before deployment. By measuring the percentage of executed test cases, DevOps teams can prevent defects early. High test coverage does not necessarily equate to better software quality, so teams should prioritize testing critical functionalities and edge cases to maximize the impact. Best practices include:
- Using code coverage tools to identify untested areas.
- Prioritizing end-to-end, integration, and unit tests.
- Automating testing as part of CI/CD workflows.
3. Code-Level Metrics
- Feature Testing: Measures whether software features are adequately tested.
- Defect Density: Identifies problematic areas in code based on the number of defects per module.
- Requirements Coverage: Ensures all business requirements are covered by test cases. Organizations should conduct frequent code reviews and static code analysis to maintain high code quality and minimize technical debt.
4. Mean Time to Failure (MTTF)
This metric quantifies the average time between software failures. A high MTTF signifies better reliability. Organizations can improve MTTF by investing in fault-tolerant architectures, chaos engineering, and proactive monitoring. Recommendations include:
- Stress-testing systems under various loads and conditions.
- Implementing redundancy and failover strategies.
5. Mean Time to Detect (MTTD)
Detecting failures quickly is crucial. Organizations with strong monitoring tools detect failures faster, reducing downtime. Implementing AI-driven monitoring, anomaly detection, and real-time logging can significantly reduce MTTD and improve system stability. Strategies include:
- Using observability tools for real-time system insights.
- Creating alert thresholds for performance anomalies.
6. Mean Time Between Failures (MTBF)
MTBF measures the average time between two failures of a software component. This metric is essential for identifying unreliable modules. DevOps teams should analyze past incidents and strengthen weak areas in their infrastructure and application code. Actions include:
- Performing root cause analysis on recurring issues.
- Enhancing error handling and recovery mechanisms.
7. Deployment Success Rate
A high deployment success rate indicates a stable and automated CI/CD pipeline. Organizations should aim for a success rate of over 90%. Deployments should be small and incremental, with robust rollback mechanisms to quickly revert changes when necessary.
8. Availability and Uptime
Monitoring uptime and planned downtime helps teams optimize system reliability. High availability architectures, redundancy, and load balancing are crucial for maintaining a resilient system.
Key DevOps Performance Indicators (KPIs)
1. Feature Prioritization
Tracking feature usage ensures teams focus on high-impact developments while retiring unused features. This prevents unnecessary complexity and enhances user experience.
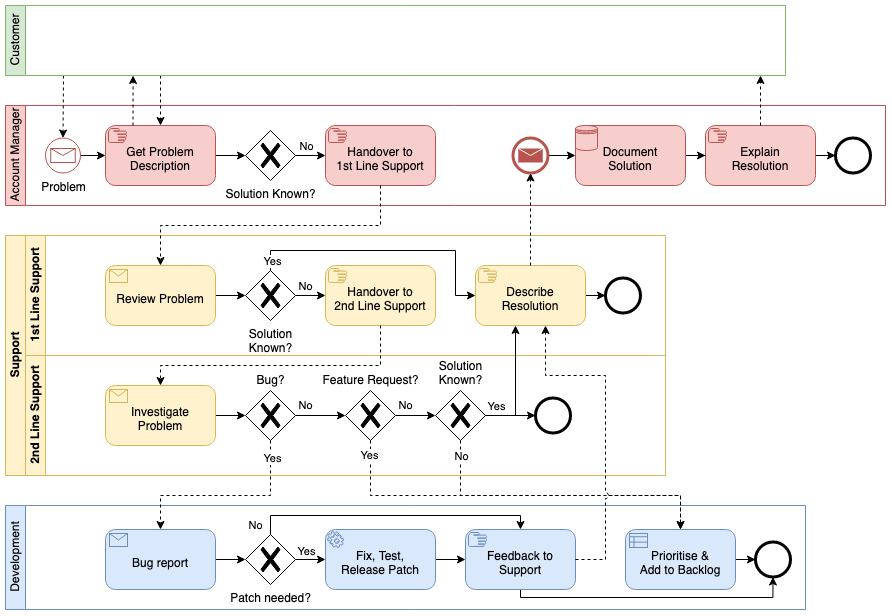
2. Customer Ticket Volume
A high ticket volume may indicate hidden issues with software quality and testing procedures. Organizations should analyze trends in customer complaints and proactively resolve recurring problems.
3. Defect Escape Rate
This KPI measures how many defects bypass testing and reach production. Lower defect escape rates correlate with better testing protocols. Implementing shift-left testing and automated quality gates can reduce defect escapes.
4. Unplanned Work
Analyzing time spent on unplanned tasks helps identify inefficiencies in DevOps workflows. Reducing unplanned work through better backlog management and incident prevention strategies leads to higher productivity.
5. Process Cycle Time
This metric tracks the total time from concept to deployment, highlighting bottlenecks. Reducing cycle time requires improving collaboration, automation, and minimizing wait times between development stages.
6. Application Performance
Post-deployment application performance should be closely monitored using DevOps tools to ensure optimal functionality. Performance regressions should be identified early using A/B testing, synthetic monitoring, and user feedback.
7. Infrastructure Cost Optimization
Tracking cloud and infrastructure costs ensures efficient resource utilization. Implementing auto-scaling, rightsizing, and cost monitoring tools can optimize spending while maintaining performance.
8. Security Vulnerability Detection Rate
Measuring the number of vulnerabilities detected and resolved within a specific timeframe ensures security compliance. Automated security scanning and DevSecOps practices help mitigate risks proactively.
Common Pitfalls in DevOps Measurement
Misconception #1: Speed vs. Security Tradeoff
Many teams believe that they must choose between speed and security. However, integrating automated security checks into CI/CD pipelines enables teams to achieve both. Security should be embedded early in the development process through DevSecOps practices.
Misconception #2: More Metrics = Better Performance
Focusing on vanity metrics (e.g., number of commits) can mislead teams. Instead, emphasize outcome-driven metrics like customer satisfaction and deployment success rate. Quality should always take precedence over sheer development velocity.
Conclusion
By adopting well-defined DevOps metrics and KPIs, organizations can enhance software quality, streamline operations, and improve overall performance. Rather than tracking every possible metric, teams should focus on measuring what truly matters—deployment reliability, defect detection, and system resilience.
For organizations looking to refine their DevOps strategy, investing in industry-leading DevOps tools and best practices will pave the way for success in 2025 and beyond.